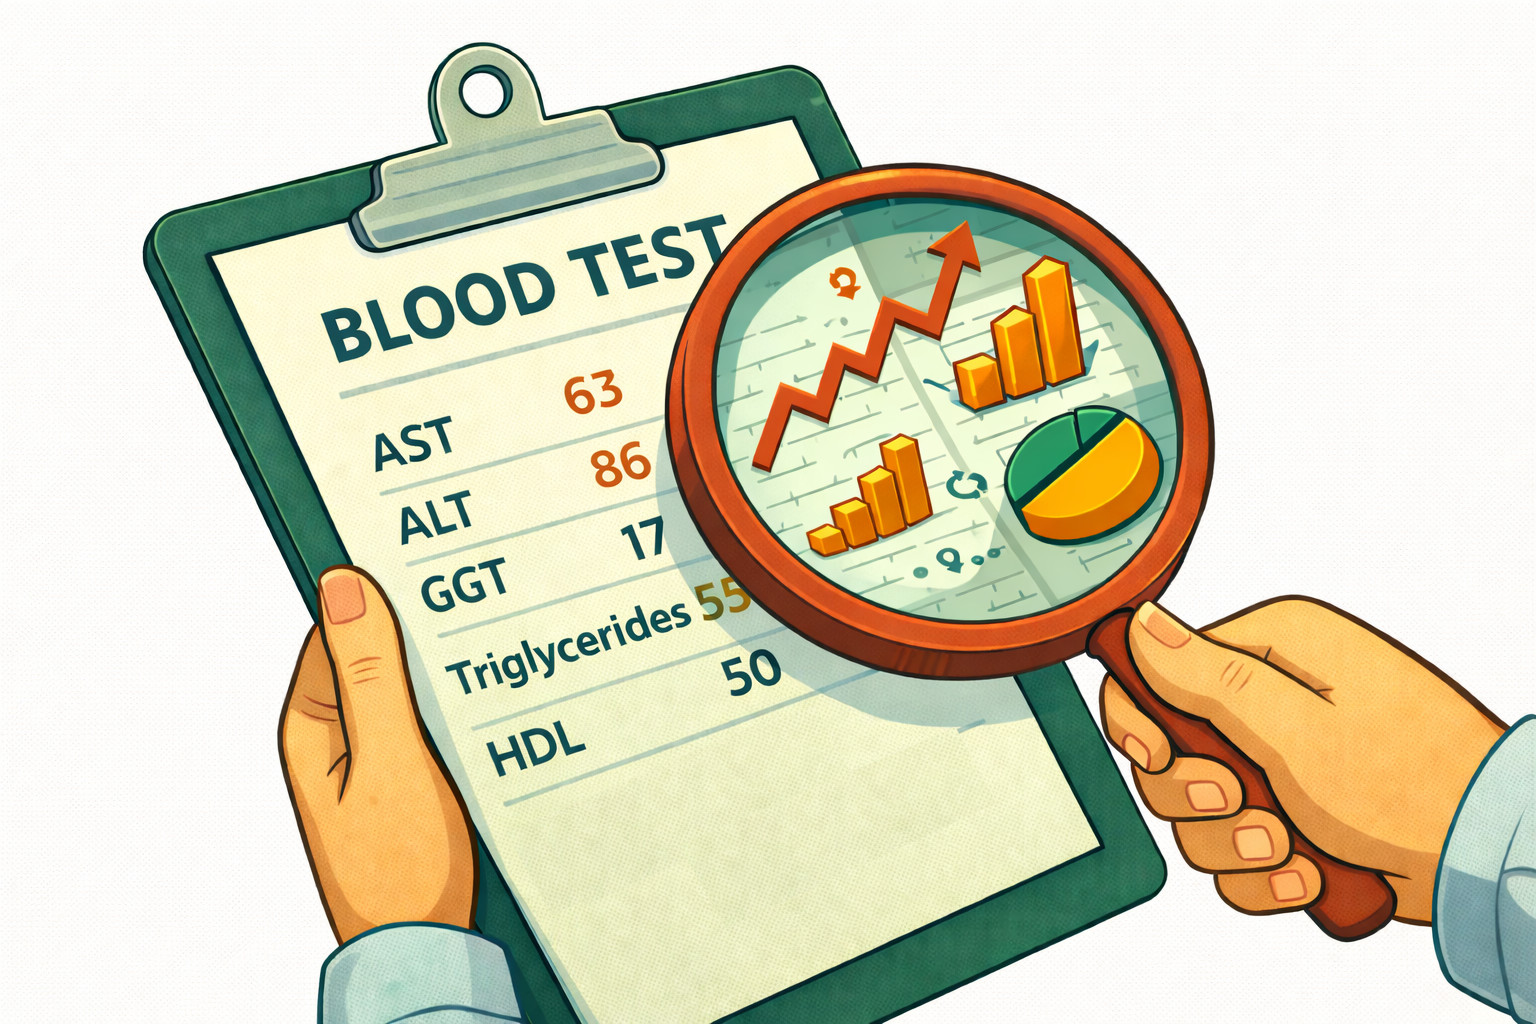
When you get your bloodwork back, the doctor usually scans it for one thing: Flags.
If your numbers aren’t bolded with a scary “H” (High) or “L” (Low), they tell you “Everything looks normal.”
But “Normal” is a dangerous word.
You have to understand how these lab ranges are determined. They are often based on a bell curve of the general population. In the 1970s and 80s, the general population was leaner and metabolically healthier. Today, the “average” person is metabolically compromised.
As the population has gotten sicker, the bar for “Normal” has shifted.

The American College of Gastroenterology has actually stated that the standard upper limits on your lab report (often 40 to 50 IU/L) are too high. They suggest the true upper limit of a healthy liver is actually 33 for men and 25 for women.
If your ALT is 39, the lab computer will flag it as “Normal.” But biologically, your liver might already be shouting for help.
For those of us with Lean Fatty Liver, “Normal” is often where the disease hides.
I stopped relying on the portal’s High/Low flags and started putting my raw data into my own spreadsheet. When you look deeper, you start to see the story your metabolism is trying to tell you.
Here are the 5 markers (and ratios) I track that go beyond the basic AST/ALT.
1. The De Ritis Ratio (AST divided by ALT)
Most people just look to see if AST and ALT are elevated. But the relationship between them tells a deeper story.
This is called the De Ritis Ratio. You simply take your AST number and divide it by your ALT number.
- If ALT is higher than AST (Ratio < 1.0): This is the classic signature of early-stage Fatty Liver (NAFLD/MASLD). The liver is irritated by fat accumulation. This was me at diagnosis.
- If AST is higher than ALT (Ratio > 1.0): In the context of liver disease, this can sometimes indicate that fibrosis is advancing (or it can be alcohol-related).
- The Goal: You want both numbers low (ideally under 30), but watching them flip-flop can give you a clue about liver stress vs. progression.
Note: As I learned in November, heavy exercise can spike AST, temporarily throwing this ratio off.
2. GGT (The “Early Warning” System)
AST and ALT are liver enzymes, but they can also leak from muscles (like after a leg day).
GGT (Gamma-Glutamyl Transferase) is different. It is highly specific to the liver and bile ducts.
If your AST/ALT are borderline but your GGT is high, that is a massive red flag that your liver is struggling to clear toxins or oxidative stress.
- Lab Range: Usually 9–48 U/L.
- My Goal: I want this in the bottom half of the range. (My December result was 17, which told me my “detox” pathways were finally working).
3. The Triglyceride / HDL Ratio (The Insulin Gauge)
This is my favorite metric because it measures Insulin Resistance—the root cause of fatty liver.
You don’t need a fancy insulin test to estimate this.
Take your Triglycerides and divide by your HDL (Good Cholesterol).
- Result < 2.0: Ideal. You are likely insulin sensitive.
- Result > 3.0: High likelihood of Insulin Resistance.
- Result > 6.0: Severe metabolic dysfunction.
Why this matters for Lean People:
You might have normal glucose (A1C). But if your Trigs are 150 and your HDL is 40 (Ratio = 3.75), your body is screaming that it can’t handle carbs properly, even if you are thin.
My goal is to keep this ratio as close to 1.0 as possible.
4. Ferritin (The Inflammation Spy)
Ferritin measures iron storage. However, it is also an “Acute Phase Reactant.” This means it spikes when there is inflammation in the body.
It is very common for Fatty Liver patients to have high Ferritin levels, even if they don’t have iron overload (Hemochromatosis). The liver is inflamed, so it dumps Ferritin into the blood.
If your doctor says “Your iron is high, stop eating red meat,” check your liver first. It might not be the meat; it might be the metabolic inflammation.
5. Platelets (The Cirrhosis Watch)
This is the scary one, but you need to know it.
As liver disease progresses to scarring (cirrhosis), the spleen gets enlarged and starts hoarding Platelets.
- Normal: 150,000 – 450,000.
- The Watchout: If your platelets start trending down year over year (e.g., 250 -> 200 -> 140), that is a sign that portal hypertension (pressure in the liver) might be increasing.
Conclusion: Build Your Dashboard
Doctors are busy. They are looking at a snapshot of your health today.
You are the CEO of your own body. You need to look at the Trend.
Open a spreadsheet. Log these numbers every time you get bloodwork.
- Is your Trig/HDL ratio going down? (Good, insulin sensitivity is improving).
- Is your GGT staying low? (Good, bile flow is healthy).
Don’t settle for “Normal.” Aim for “Optimal.”